Recent posts

Geek Chic
How to Replace A Broken Lenovo Laptop Screen
24 April 2025

Money Talks
Everything You Need to Know About SASSA Status Check
13 April 2025

Mind, Body & Soul
The Genetic Diversity of Cannabis Seeds
12 April 2025

Money Talks
How Small Businesses Can Leverage Blockchain Technology
02 April 2025
Popular posts
Extravaganza
Trending Music Hashtags To Get Your Posts Noticed
24 August 2018
Geek Chic
How To Fix iPhone/iPad Only Charging In Certain Positions
05 July 2020
Extravaganza
Trending Wedding Hashtags To Get Your Posts Noticed
18 September 2018
Money Talks
How To Find Coupons & Vouchers Online In South Africa
28 March 2019
How To Filter Looker Studios Data By Specific URL List
12 July 2023 | 0 comments | Posted by Che Kohler in nichemarket Advice
Looker Studio, formerly known as Google Data Studio, is a data visualisation platform that makes reports easier to create and understand. In comparison, it might not have been as popular with marketers in the past who were all too used to the standard reporting provided by UA3 and its ability to easily query information from those reports; that has all changed with the migration to GA4.
In GA4, you're sitting with more of a data-capturing and processing interface and outsourcing your reporting and queries to Looker Studios, so users and marketers will need to get comfortable with these new Dashboard builders.
What we've lost in UA3, you can rebuild in Looker Studios; with even more customisation and granularity, you have way more control over data manipulation, which can be a good thing for those who know how to use it, but it can be a pain for those who are coming into the space now and feel overwhelmed by all the options available.
GA4 and Looker Studios can't fix bad data feeds
GA4 and Looker Studios can help you capture and process data, but they can't solve issues you've made in terms of tracking or how you've structured your website.
We as humans are bound to push errors into our data, especially if we've outsourced tracking to 3rd parties like agencies or different marketers or data analysts who have taken over the profile and pushed in their own events. The longer no one takes charge of the data and acts as the custodian, the more mistakes will be tracked; the more mistakes tracked, the harder it is to process your data and compare data sets.
Off the top of my head, popular data issues I've seen in many profiles are those who have created unnecessary pain for themselves.
- If you've created a host of events that are mixed case and snake case
- If your site has a flat URL structure,
- If you're using 1 GA4 account across multiple domains or subdomains
- If you're native app events and web events are named differently
- If you have legacy events floating around and have not had an audit in some time
Ideally, you would want to get a data professional to review your profile and see where it can be future-proofed to provide a cleaner data set going forward because there is nothing you can do about historical data.
The pain of a flat URL strucutre or no unique identifer
If you do have a flat URL structure or you're sitting with URLs that generate without real consistency because slugs were manually created by users throughout the years, you will eventually find it hard to group and compare data.
So what do you do if you want to report on certain URLs? If there's no /path/ to group them with or consistent keyword or element, how would you group your data?
Well, you have three options:
- Filters
- Parameters
- Blended data sources
Filters won't always work.
If you have a smaller site, filters in Looker Studios can be your saviour; in this case, all you would do is edit your data set, be it a chart or graph or table, scroll down to the filter section, click add a filter and include only the URLs you want to see or set broader rules to exclude certain URLs.
Filters will allow you to select from any dimension in your GA4 account and set
- Include
- Exclude
- Match by
- Equals to
- Contains
- Matches regex
- Contains regex
- In
- Is equal to Null
You can set rules based on
- And
- Or
And you can use both in combination where needed to create a pretty complex filter, but remember; filters can't always exclude every outlier and the more complex your filter, the more of a chance rules conflict and your data source will break, rendering no results.
Custom page view event
If you think that filters are going to be a pain to manage and you're looking to future-proof your data sets but don't want to change anything on-site such as slugs or URL structure, your next best option would be to use a custom parameter.
In UA3, this could be done through virtual page views, which overwrote the original page URL to a cleaner one to report on or to create custom content groupings.
In GA4, you could customise your page view tag with a parameter that fires when a URL meets certain criteria; this could be through placing a custom data layer on page URLs to group them or building a lookup table in Tag Manager to push through a unique output if a URL meets certain criteria.
For example, if profile pages on your site are
- nichemarket/user-1
- nichemarket/users-4
- nichemarket/1-user
- nichemarket/account-1
could add a lookup table for all these variations and push through a parameter stating these are "profile" pages and then filter all your data by profile pages.
Cleaning up your data
If you're not able to make changes to your website, update tags or feel comfortable with Tag Manager, but you're still looking for a way to report on seemingly random pages, your next option would be to leverage blended data sources.
What are blended data sources?
Blending data lets you create charts, tables, and controls based on multiple data sources. For example, you can blend data from different BigQuery tables—say, customer information and order details—and visualise that information in a single Looker Studio table.
A blended data source can come from public data, third-party data and even Google Sheets you've created. It lets you bring in sets of data from various places into one location so you can turn that information into an easy-to-understand report.
While most uses for blended data revolve around combining reports, we're going to use it to filter out a report.
Filtering a report with blended data
Let's say you've created a chart, and you're pulling in
- Page Title
- Page path
- Preferred metrics, let's say, sessions or views
- Preparing your data
- Instead of trying to filter by page path or page title, you will create a list of Page Titles and URLs you wish to use as your filter and add them to a Google sheet.
- Create a two-column sheet with your page titles and URLs underneath, like below.
| Page title | Page URL |
| page title 1 | /slug1 |
| page title 2 | /slug2 |
| page title 3 | /slug3 |
Connecting your sheet
- Once you're happy with your sheet, connect it as a data source by clicking
- Add data
- Select Google sheet
- Select your sheet by name
- Select the tab you wish to import
Blog-blending-data-sources.png)
Blending data sources in Looker Studios
Blending your data
- Now head back to the chart you wish to filter and navigate underneath your data source and select "Add Blended Data Source:."
- Give your new data source a name; IE blended users or pages.
- Select GA4 as your primary source.
- Select the page title and page path as your dimension.
- Select the various metrics you want to see, IE, views, sessions, and engagement.
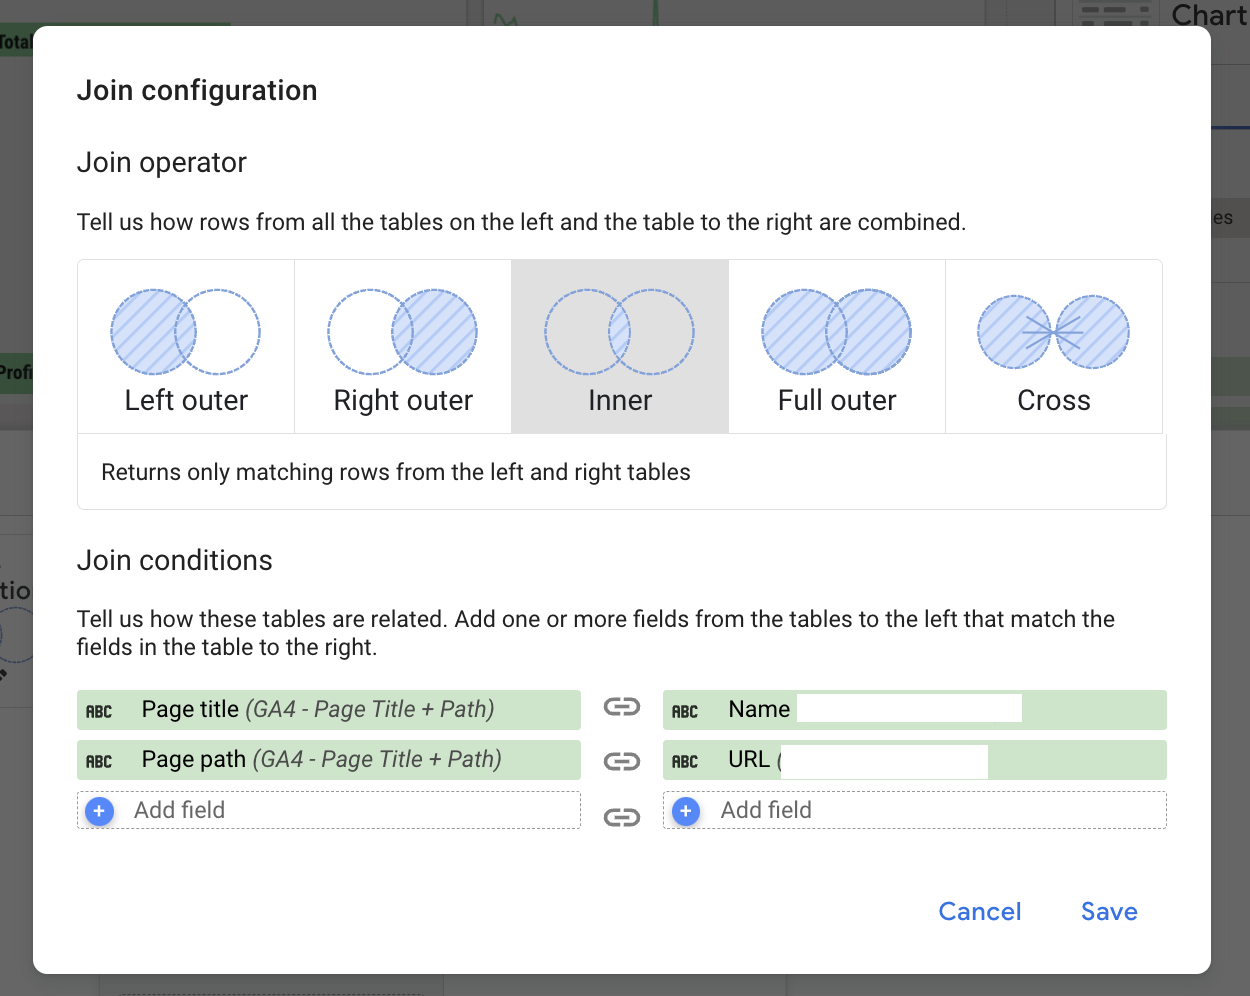
- Navigate to considerations and select "inner" This will ensure you only show data when your dimensions match your blended source.
- Now match your GA4 dimensions with your Google sheet columns.
- Click save condition
- Click save again to save the blended data source.

Matching your two sources when blending data
If done correctly, your chart will only pull in data for the URLs you specified in your Google sheet, and you can always update the sheet to add new entries you wish to include in the future.
Contact us
If you want to know more about digital marketing or feel this entire GA thing is too much of a bother and you need it sorted by experts, then we’re happy to assist. Simply contact us, and we can sort out your data migration for you.
Are you looking to promote your business?
Business owners can create their free business listings on nichemarket. The more information you provide about your business, the easier it will be for your customers to find you online. Registering with nichemarket is easy; all you will need to do is head over to our sign-up form and follow the instructions.
If you require a more detailed guide on creating your profile or listing, we highly recommend you check out the following articles.
Recommended reading
If you enjoyed this post and have a little extra time to dive deeper down the rabbit hole, why not check out the following posts about Google Analytics?
- How To Track Social Sharing In Google Analytics
- Get Back Your Google Analytics Account With These Simple Steps
- How To Properly Set Up Google Analytics With Shopify Sites
- Google Analytics Interaction Hit Vs Non-Interaction Hit
- How To Track Video Views With Google Analytics
- How To Track Search and Zero Search Queries In Google Analytics
Tags: Data, Big Data, Data Management
You might also like
The Role of Customer Service in Selecting a Forex Broker
29 March 2025
Posted by Cornelia Ekong in Money Talks
Discover why excellent customer service is crucial when choosing a Forex broker, and learn how to evaluate support quality before committing your cap...
Read moreMastering Personalization in Digital Marketing
31 March 2025
Posted by Željka Ristic in Industry Experts
We look at the best content marketing tools to boost engagement and growth and build sustainable marketing campaigns that drive users to take action
Read more{{comment.sUserName}}
{{comment.iDayLastEdit}} day ago
{{comment.iDayLastEdit}} days ago
 {{blogcategory.sCategoryName}}


