Recent posts

Money Talks
A Guide To ClickCredit Loan Rates and Terms
05 June 2026

Ace of Trades
How To Select Laser Cutting Machines for Industrial Applications
29 May 2026

Fur, Fins & Feathers
Navigating Pet Food Philosophies: Natural vs Veterinary vs Breed-Specific
26 May 2026

Money Talks
Ramaphosa’s 2026 Foreign Policy: Balancing BRICS+ & Western Ties
22 May 2026
Popular posts
Extravaganza
Trending Music Hashtags To Get Your Posts Noticed
24 August 2018
Geek Chic
How To Fix iPhone/iPad Only Charging In Certain Positions
05 July 2020
Extravaganza
Trending Wedding Hashtags To Get Your Posts Noticed
18 September 2018
Money Talks
How To Find Coupons & Vouchers Online In South Africa
28 March 2019
New Session Quality Report In Google Analytics
09 April 2017 | 0 comments | Posted by Che Kohler in nichemarket Advice
Google Analytics continues to adopt machine learning and has rolled out its third machine learning feature called Session Quality. Similar to Smart Lists and Smart Goals, Session Quality scores are generated by GA automatically based on the evaluation results of each session’s site engagement. As far as we can tell, Google Analytics quality session report primary goal is to encourage site owners to adopt remarketing or optimise current remarketing efforts.
However, it will prove to be an
About session quality
User engagement is evaluated for each session, and the resulting proximity to conversion is expressed as a score of 1-100 for each session during the date range, with 1 being the farthest from and 100 being the closest to a transaction. A value of 0 indicates that the metric is not calculated for the selected time range. So what does this even mean?
It means that Google Analytics will help you evaluate certain behavioural trends that normally lead to a user converting on your site. When users hit those flags they are categorised into quality score segments, which you can later store and create remarketing audiences. This type of tools will see remarketing continue to overlap with CRM strategies and not as a brand or display marketing too. CRM managers will need to add this into their flows as to optimise their customer touch points.
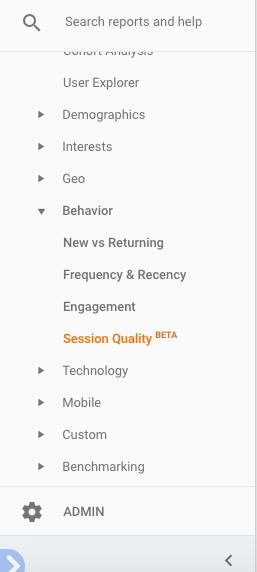
How to find the Session Quality data report:
- Sign in to Google Analytics
- Navigate to your view
- Open Reports
- Select Audience > Behavior > Session Quality
Prerequisites
In order to calculate these reports Analytics needs the following data: A minimum of 1000 eCommerce transactions per month. You must have implemented eCommerce tracking. Once you reach the threshold of 1000 eCommerce transactions per month, Analytics then needs 30 days of data at that level to model.
Session quality report
Session Quality is calculated for individual sessions
Average Session Quality is calculated for all sessions related to a dimension for the date range you’re using, for example:
- The score for all sessions where Source = google during January 1 - January 31
- The score for all sessions where Country = India during January 1 - January 31
The Session Quality metric is shown in the Session Quality report, and in Analytics segments, remarketing audiences, and custom reports. The Avg. Session Quality metric is shown in the Session Quality report and is also available in custom reports.
The Session Quality report
The Session Quality report lets you see:
- The distribution of users, and sessions with and without transactions, across 5 session-quality buckets (histogram)
- Acquisition, behaviour, and conversion metrics for sessions across the dimensions of Default Channel Grouping, Source, and Medium (table)
The Users column of the histogram usually totals to more than the number of users in the scorecard at the top of the report. The scorecard is the number of unique users for the date range. During that time, those users may conduct multiple sessions that have different quality scores. Consequently, a user is often counted in more than one session-quality bucket during a given time range.
Using session-quality data
Segments
With segments, you can look at any of your data in the context of session-quality thresholds. For example, you can create a segment for Session Quality > 75, and then examine things like:
- How your users who demonstrate a strong likelihood to convert compare with your overall user base.
- Do they represent a small fraction of your users or do your advertising and site combine to engage a large percentage of your users?
- Which of your keywords and campaigns deliver highly engaged users.
- Which conversion paths are most effective, and where along the path can you deliver the most effective advertising.
Conversely, you can use a low threshold to examine the opposite end of the user spectrum:
- What percentage of your users conduct low-quality sessions?
- Are the keywords and campaigns that draw users who conduct low-quality sessions different from the ones that draw more valuable users?
- If they are, does it make sense to devote less budget to them?
- Which conversion paths do the lower-scoring users follow?
- Are there opportunities along those paths to deliver more effective marketing?
Remarketing audiences
Users who are on the threshold of converting are more easily convinced to complete those conversions. For example, users who have studied product details or added items to their carts have given strong signals that they’re already taking ownership of those products.
Creating remarketing audiences based on your highly engaged users and publishing those audiences to your various marketing platforms like AdWords and DoubleClick Bid Manager lets you re-engage the most likely customers everywhere you have an online presence to get them to convert even faster or more regularly. A persuasive follow-up from you via a well-crafted remarketing campaign can provide that last nudge they need to complete the process.
Google Optimize
You can also publish these audiences directly into Optimize so that you can understand exactly which refinements to your site content deliver the highest likelihood of conversion.
Quality in the quantity
So what do you make of quality session reports, is it something you would use? Or is it just another vanity metric? Let us know in the comments section below
Contact us
If you want to know more about marketing bots don’t be shy we’re happy to assist. Simply contact us here
You might also like
Navigating Pet Food Philosophies: Natural vs Veterinary vs Breed-Specific
26 May 2026
Posted by Kim Irwin in Fur, Fins & Feathers
Choosing the right pet food involves balancing marketing philosophies with scientific realities and considering how your pet reacts to its diet.
Read more
Protection Strategies That Work For Shipping Fragile Items
12 May 2026
Posted by Che Kohler in Shopaholics
If you are boxing up fragile items for shipping or moving into self-storage and want to avoid as much breakage as possible, then these tips will help...
Read more{{comment.sUserName}}
{{comment.iDayLastEdit}} day ago
{{comment.iDayLastEdit}} days ago