Recent posts

Shopaholics
How to Choose A Perfect 2-Seater Couch for Small Spaces
28 February 2025

Money Talks
How Crypto Technology Continues To Revolutionise The Business World
27 February 2025
nichemarket Advice
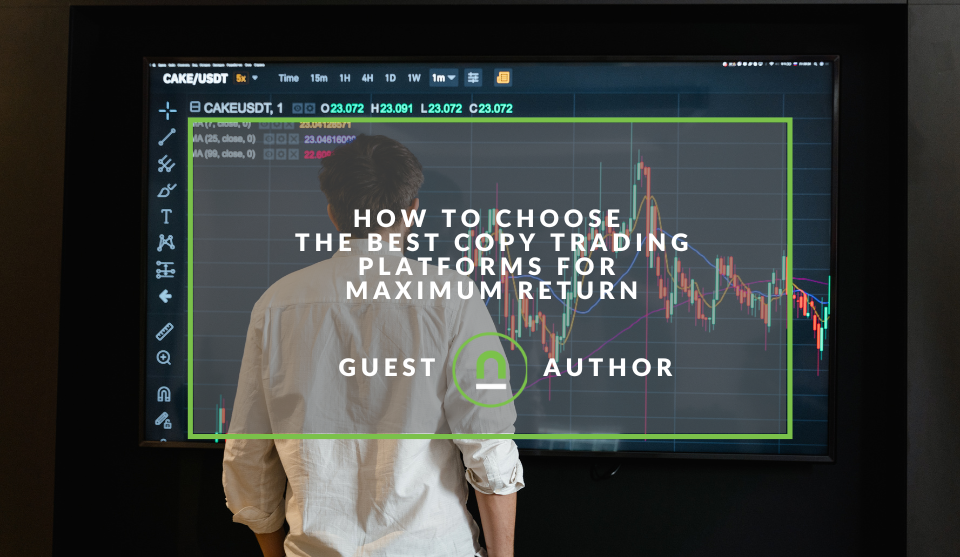
How to Choose the Best Copy Trading Platforms for Maximum Return
24 February 2025

Mind, Body & Soul
A Guide to Cannabis Seeds in South Africa
21 February 2025
Popular posts
Extravaganza
Trending Music Hashtags To Get Your Posts Noticed
24 August 2018
Geek Chic
How To Fix iPhone/iPad Only Charging In Certain Positions
05 July 2020
Extravaganza
Trending Wedding Hashtags To Get Your Posts Noticed
18 September 2018
Money Talks
How To Find Coupons & Vouchers Online In South Africa
28 March 2019
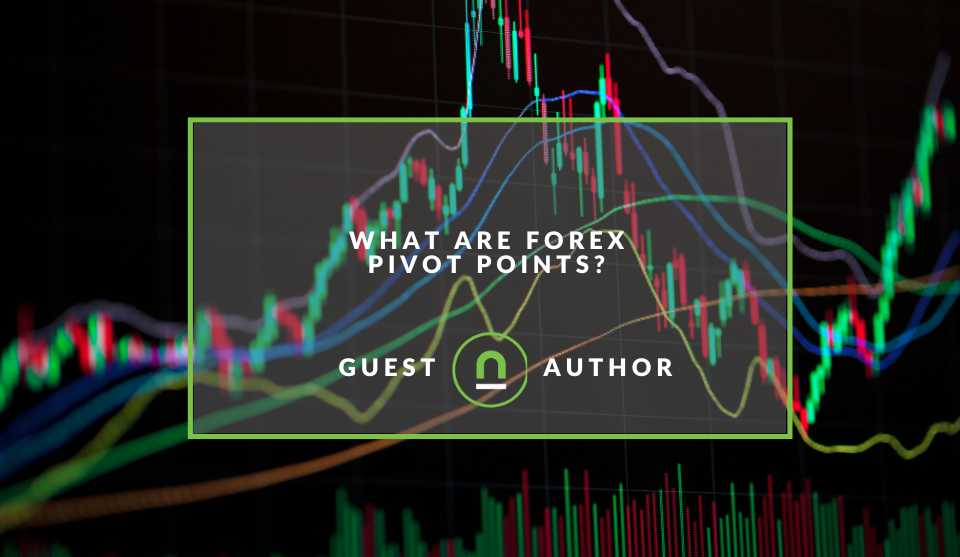
What Are Forex Pivot Points?
02 July 2024 | 0 comments | Posted by Edward Fourie in Money Talks
The forex market is complex, and relying on more than just one technical tool can be risky. Various analysis methods provide a more comprehensive picture and help traders filter out false signals between currency pairs.
The more data you have and the techniques for processing the data, the stronger your chances of appropriately making better trades and hedging risk.
Pivot points are technical indicators traders use to identify potential trend turning points. In forex and other markets, calculating pivot points helps traders identify support and resistance levels.
This further helps them employ various strategies to target profits and set up losses.
What are forex pivots used for?
Forex pivot points are a popular tool among experienced traders. They offer a relatively simple way to identify potential support and resistance zones.
Traders use pivot points to identify areas where prices might encounter buying or selling pressure, potentially causing a reversal in trend. The idea is that these levels act as psychological barriers, attracting traders who place orders anticipating a bounce off those points.
They are a leading indicator, attempting to predict future price movements.
There are different variations of pivot points, with some incorporating additional price data points like the opening price.
Pivot points are most effective in a range-bound market where prices are consolidating within a specific range.
They should be used in conjunction with other technical analysis tools for a more comprehensive trading strategy.
Calculating pivot points
Traders can easily calculate pivot points using basic mathematics. The traditional and standardised method uses the previous high, low, and close, as well as three additional support and resistance levels.
This provides seven forex pivot points in total.
The calculations in this method are as follows:
- Pivot Point (P) = (previous high + previous low + previous close) / 3
- Support 1 (S1) = (P * 2) - previous high
- Support 2 (S2) = P - (previous high - previous low)
- Support 3 (S3) = previous low – 2 (previous high - P)
- Resistance 1 (R1) = (P * 2) - previous low
- Resistance 2 (R2) = P + (previous high - previous low)
- Resistance 3 (R3) = previous high + 2(P - previous low)
Finding the pivot points is critical in helping traders judge the bias of a trading session.
Pivot points in trading strategies
Pivot points are indicators used to find turning points in trends. Regardless of their accuracy, pivot points will not help traders earn a profit on their own.
Instead, they are tools to be used in trading with strategies so that traders can make more informed financial decisions. While some use them to determine levels of entry, stops, and profit-taking, others use them with other technical indicators in more complex strategies.
Candlestick Strategy
Candlestick charts are most likely where traders will encounter pivot points. On charts like these, it's easier to find and work off of trends with pivot points, as they often act as the key resistance and support levels. Alongside the Relative Strength Index, one can more easily gauge a security's momentum.
The candlestick succeeds by establishing a foundational understanding of where trends might pivot and reverse and focusing on the patterns themselves. This reduces the possibility of false flags and increases the possibility of profit.
Camarilla Pivot Point Strategy
The candlestick method is often best suited for day charts and is often adapted to medium- to long-term trades. An alternative is the Camarilla Pivot Point strategy, which focuses on accuracy in short-term trading.
It accomplishes this by placing four resistance and support levels relatively close together using the following method:
- Resistance 4 (R4) = closing + ((High - Low) * 1.5000)
- Resistance 3 (R3) = closing + ((High - Low) * 1.2500)
- Resistance 2 (R2) = closing + ((High - Low) * 1.1666)
- Resistance 1 (R1) = closing + ((High - Low) * 1.0833)
- Pivot Point (PP) = (high + low + closing) / 3
- Support 1 (S1) = closing - ((High - low) * 1.0833)
- Support 2 (S2) = closing - ((High - low) * 1.1666)
- Support 3 (S3) = closing - ((High - low) * 1.2500)
- Support 4 (S4) = closing - ((High - low) * 1.5000)
With the Camarilla strategy, traders can find new ranges to trade in on a day-to-day basis. Many choose to focus on the pivots of R3 and S3, trading within this range for short-term reversals.
This is what's known as the 'Daily Range'.
Alternatively, some traders use this method to find key levels of entry, stop, and limits when analysing trends. In this case, many prefer to look for buying opportunities around S3, with a stop set at S4. Moreover, traders look for selling opportunities at R3 and a stop set at S4. How a trader sets their take-profit level will largely depend on their preferences and style.
The Camarilla strategy isn't beginner-friendly, however, and isn't as widely applicable to longer-term trading.
One piece of the puzzle
Forex pivot points are one piece of the puzzle when it comes to technical analysis in forex trading. Here are some common techniques that are often used alongside pivot points:
- Price Action: This involves analysing the raw price movements on the chart, focusing on things like candlestick patterns, trendlines, and support and resistance zones identified directly on the price chart. By observing how price interacts with these levels, traders can make informed decisions about potential entry and exit points.
- Moving Averages: These are trend-following indicators that smooth out price fluctuations and highlight the general direction of the market. Popular moving averages include the 50-day and 200-day moving averages. Traders can use pivot points in conjunction with moving averages to see if the price is approaching or breaking above/below a key moving average, which can signal a potential trend change.
- Oscillators: These indicators measure the momentum or relative strength of a price movement. Common oscillators include the Relative Strength Index (RSI) and Stochastic Oscillator. Pivot points can be used together with oscillators to identify overbought or oversold conditions, which might suggest a price reversal is likely around those pivot levels.
- Volume: Monitoring trading volume can provide additional insights. If the price breaks through a pivot point with significant volume, it suggests a stronger breakout compared to a low-volume breakout, which might be less reliable.
- Fibonacci Retracements: This technique identifies potential retracement levels after a strong price move. These retracement levels can coincide with pivot points, strengthening the potential support or resistance at those zones.
Remember, the key is to use a confluence of these techniques. For instance, a price approaching a pivot point while also nearing an oversold reading on the RSI could be a stronger signal for a potential reversal compared to just the pivot point alone.
By combining pivot points with other technical analysis tools, traders can gain a more complete picture of potential trading opportunities.
It's important to remember that no single indicator is perfect, and combining them can help to filter out false signals.
When to pivot and when to stick
Even though pivot points are helpful indicators, they are best used alongside other variables and strategies to make financial decisions. Their biggest strength lies in determining price movements.
However, that isn't always guaranteed to be accurate, so a stop-loss will help minimise much of the risk.
Tell us your story
Would you like to write for a nichemarket just like Muhammad does? Find out how to submit a guest post, and when you're ready, you can contact us.
Do you need financial help?
Find a financial advisor or financial consultant in your area
Get started with nichemarket
If you are a financial adviser and would like more leads, why not list your business with nichemarket?
Registering with nichemarket is easy; all you will need is to head over to our sign-up form and follow the instructions. If you require a more detailed guide on how to create your profile or your listing, then we highly recommend you check out the following articles.
Recommended reading
If you enjoyed this post and have the time to spend diving deeper down the rabbit hole, then we suggest you check out the following posts about improving your finances in South Africa.
- What Is A Money Market Account?
- Ways To Earn Cryptocurrency
- How To Passively Earn Cryptocurrency
- Types Of Cryptocurrency Exchanges
- How South Africans Can Buy Bitcoin
Disclaimer: This is not investment advice and is for informational purposes only. nichemarket cannot be held liable for any investment decisions made based on the information given by independent financial service providers. Under the ECT Act and to the fullest extent possible under the applicable law, nichemarket disclaims all responsibility or liability for any damages whatsoever resulting from the use of this site in any manner.
Tags: Investment, Money, Forex, Guest Post
You might also like

Permission-Based Marketing: Why Opt-Ins Are Non-Negotiable
07 February 2025
Posted by Alejandra Leyva in Industry Experts
Learn all about permission-based marketing and why it is key for genuine customer engagement. Learn why opt-ins are non-negotiable for building trust...
Read moreHow to Choose the Best Copy Trading Platforms for Maximum Return
24 February 2025
Posted by Cornelia Ekong in nichemarket Advice
How to select a copy trading platform by evaluating key features, trader performance, risk management tools, and costs to maximize your investment re...
Read more{{comment.sUserName}}
{{comment.iDayLastEdit}} day ago
{{comment.iDayLastEdit}} days ago